
I’ve been wanting to write this article for a while now. Seeing multiple screenshots of Squawka comparisons posted on Twitter with the wrong stats being used has made my blood boil, and a hatred for Squawka. But, in all fairness, it isn’t Squawka’s fault. People are using the numbers, which I commend Squawka for offering to the general public, in the wrong manner. It’s very easy to sway the statistics used to give the desired output, as I have shown below:
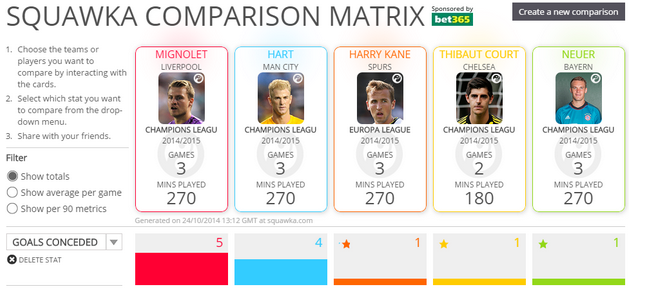
Here, I made Harry Kane look as good a goalkeeper as Courtois and Neuer after his spell in goal in Tottenham’s Europa League tie a few weeks back. Anybody who saw that game, and the goal he conceded, will know that he isn’t as good as the best two goalkeepers in the world, but I’ve managed to find statistics to back up my point. And here’s what the aim of the article is to display; to show that the interpretation of statistics is incorrect and needs to be changed.
For example, people are big fans of Goals and Assists statistics. While these can sometimes be useful, it doesn’t show how good a player is: for example, Berahino, Pelle, Sakho and Austin all have all scored more goals in the Premier League than Di Maria, Rooney or Falcao. Does this mean they are better players? In the same manner; Sigurdsson, Baines and Tadic have given more assists than Di Maria, Hazard or Sanchez. Again, does that mean Leighton Baines is a better playmaker than Angel Di Maria? Some may say in response that the “per 90 metrics” option is more accurate to display these, which is true: Baines has played 10 games to Di Maria’s 8 and Falcao’s 5, however these still aren’t reliable.
Why? Because your assist is only as good as the ability of your striker to put the chance away. For example, Eden Hazard, Chelsea’s Player of the Year last season, got 7 assists in 35 games in the PL in 13/14, with a strikeforce that Mourinho was quoted saying “I have no striker”. In contrast, so far this season, Cesc Fabregas has 9 assists in 10 games, with an in form Diego Costa to put the chances away. This is why Chances Created are a better statistic; if you are continuously putting balls into the striker. and he’s having a stinker of a game, you still deserve some sort of recognition despite not gaining any assists. In the same manner, if you’re a striker who keeps shooting on target and the goalkeeper is having a worldie, again you deserve recognition for having a good game.
So, below, I’ve used these statistical interpretations in addition to others, on the Squawka comparison website, to compare two players who are hotly contested on social media as to whom is better; Eden Hazard and Alexis Sanchez; and then 3 other players who play in similar roles for their respective clubs; Neymar, Gareth Bale, and Mario Gotze, to provide another context.
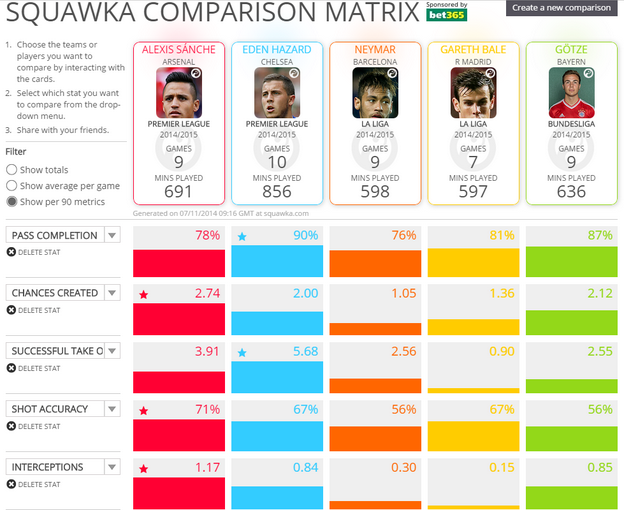
Statistics for Domestic League appearances only
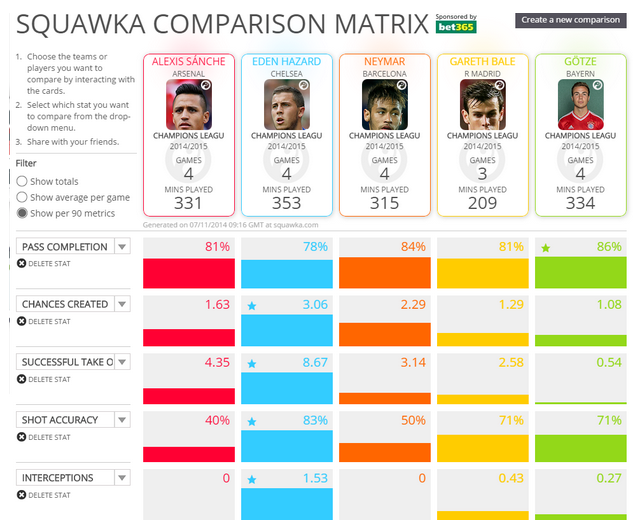
Statistics for Champions League appearances only
In my opinion, the statistics used above display all the qualities Sanchez and Hazard need to possess to aide their clubs. They both cut in from the wing to make chances for both themselves and other players, and for the aforementioned reasons about accuracy, Chances Created and Shot Accuracy are used over Assists and Goals. Pass Completion displays the quality and accuracy of their passes, Successful Take Ons are used as an indicator of the quality of their dribbling, and finally, the Interceptions numbers are used to display how good the players are at tracking back; something Hazard has been made to work on by Jose Mourinho, and something Sanchez must do to support Kieran Gibbs if he is caught on the overlap. Therefore, I think it is fair to say this is an adequate comparison between these players.
Rather annoyingly, Squawka don’t provide an all appearances in one season option (or indeed a Domestic Cup option for Hazard’s games against “Strawberry”). However, using a weighted mean (this is where my learning of Maths A Level comes in handy), I can make a joint table of PL and CL statistics:

This is quite a handy table of comparisons between the five players, as I have nicely highlighted the best performance in a way similar to Squawka’s stars, as well as giving an “Average ranking”. This Average Ranking is a very crude, rough estimate of how good a player is overall, ranking how good they were in each section (i.e. Pass Completion), and then an average of these ranks. They don’t take into account how dominant a player is in certain areas, like Hazard is by far the best at Take Ons, but was a close second to Gotze at Pass Completion; regardless of this, they are still ranks of 1 and 2 respectively.
So, in conclusion, I hope to have covered two things today: the first that there are ways of using Statistics in the correct manner to compare similar players, however you have to seriously consider which statistics you are using, and how (and not just use statistics which support your point of view if you are serious about your analysis); and the second that, in contrast with the basic Goals and Assist numbers, the more apt statistics indeed show Hazard is a more rounded player on form this season.

Latest posts by Ben Joyce (see all)
- Marcos Alonso: Should old acquaintance be forgot… - January 3, 2018
- Josh McEachran: The Prodigal Son Returns - January 28, 2017
- “We’re top of the League!” – Antonio Conte’s 3-4-3 - December 3, 2016